Monitoring AI API Performance with Prometheus and Grafana
TL;DR
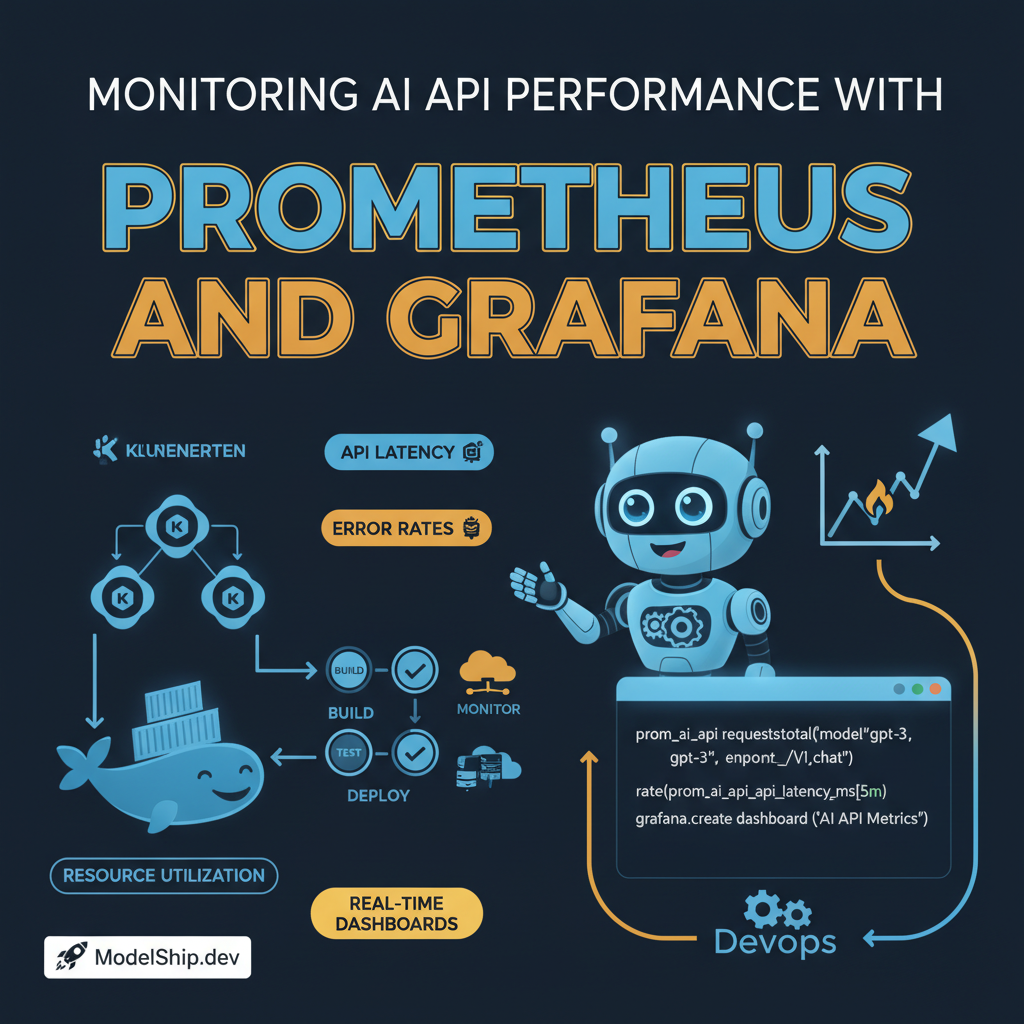
The key insight here is that monitoring AI API performance is crucial for efficient DevOps. In this tutorial, we will explore how to use Prometheus and Grafana to monitor AI API performance. By the end of this tutorial, you will be able to set up a monitoring system that provides insights into your AI API's performance.
Key Takeaways
- Understand the importance of monitoring AI API performance
- Learn how to set up Prometheus and Grafana for monitoring
- Discover how to create custom dashboards for AI API performance metrics
- Learn how to troubleshoot common issues with AI API performance
- Understand how to integrate monitoring with CI/CD pipelines using <a href="/blog/ci-cd-for-ai-apis-with-circleci-and-github-actions">CI/CD for AI APIs</a>
Introduction to Monitoring AI API Performance
Monitoring AI API performance is crucial for efficient DevOps. The key insight here is that AI APIs are complex systems that require careful monitoring to ensure optimal performance. In this tutorial, we will explore how to use Prometheus and Grafana to monitor AI API performance.
Setting Up Prometheus
Prometheus is a popular monitoring system that provides insights into system performance. To set up Prometheus, you will need to install the Prometheus server and configure it to scrape your AI API's metrics. What most tutorials miss is that you need to configure Prometheus to handle the specific metrics generated by your AI API.
Configuring Prometheus
To configure Prometheus, you will need to create a configuration file that specifies the metrics to scrape and the frequency of scraping. Here's an example configuration file:
global:
  scrape_interval: 10s
scrape_configs:
  - job_name: 'ai-api'
    scrape_interval: 10s
    metrics_path: /metrics
    static_configs:
      - targets: ['localhost:8000']
Setting Up the Prometheus Server
Once you have configured Prometheus, you can set up the Prometheus server. The server will scrape your AI API's metrics and store them in a time-series database. Let's break this down step by step: first, install the Prometheus server using your package manager, then start the server using the configuration file you created.
Setting Up Grafana
Grafana is a popular visualization tool that provides insights into system performance. To set up Grafana, you will need to install the Grafana server and configure it to connect to your Prometheus server. The key insight here is that Grafana provides a user-friendly interface for creating custom dashboards.
Configuring Grafana
To configure Grafana, you will need to create a configuration file that specifies the Prometheus server to connect to. Here's an example configuration file:
datasources:
  - name: Prometheus
    type: prometheus
    url: http://localhost:9090
Creating Custom Dashboards
Once you have configured Grafana, you can create custom dashboards for your AI API's performance metrics. What most tutorials miss is that you need to create a dashboard that provides insights into the specific metrics generated by your AI API. For example, you can create a dashboard that displays the latency and throughput of your AI API.
Troubleshooting Common Issues
Troubleshooting common issues with AI API performance is crucial for efficient DevOps. The key insight here is that you need to identify the root cause of the issue and take corrective action. For example, if your AI API is experiencing high latency, you may need to optimize the model or increase the resources allocated to the API.
Identifying the Root Cause
To identify the root cause of the issue, you will need to analyze the metrics generated by your AI API. Let's break this down step by step: first, analyze the latency and throughput metrics to identify any bottlenecks, then analyze the error metrics to identify any issues with the model or API.
Taking Corrective Action
Once you have identified the root cause of the issue, you can take corrective action. For example, if the issue is due to a bottleneck in the model, you may need to optimize the model or increase the resources allocated to the API. A common misconception is that you can simply throw more resources at the problem without optimizing the model.
Integrating with CI/CD Pipelines
Integrating monitoring with CI/CD pipelines is crucial for efficient DevOps. The key insight here is that you need to automate the monitoring process to ensure that your AI API is performing optimally. For example, you can use Kubernetes to automate the deployment of your AI API and CI/CD tools to automate the testing and deployment of your AI API.
Automating the Monitoring Process
To automate the monitoring process, you will need to integrate your monitoring system with your CI/CD pipeline. Let's break this down step by step: first, configure your CI/CD pipeline to deploy your AI API to a containerized environment, then configure your monitoring system to scrape the metrics generated by your AI API.
Frequently Asked Questions
What is Prometheus?
Prometheus is a popular monitoring system that provides insights into system performance.
How do I configure Grafana?
To configure Grafana, you will need to create a configuration file that specifies the Prometheus server to connect to.
What is the purpose of integrating monitoring with CI/CD pipelines?
The purpose is to automate the monitoring process to ensure that your AI API is performing optimally.
Conclusion
In conclusion, monitoring AI API performance is crucial for efficient DevOps. By using Prometheus and Grafana, you can gain insights into your AI API's performance and take corrective action to optimize it. Remember to integrate monitoring with CI/CD pipelines to automate the monitoring process and ensure that your AI API is performing optimally. Here's why this matters: by monitoring your AI API's performance, you can ensure that it is providing accurate and reliable results, which is critical for many applications.
PhD in NLP, now building AI products. I explain the 'why' behind AI systems so you can make better engineering decisions, not just copy-paste code.
More from Dr. Sarah Kim →Discussion
Loading comments…
Leave a comment
Related Articles